Running and Debugging
Debugging

VSCode lets you debug without modifying your code
Add breakpoints and view variables be updated as the code runs


| Action | Shortcut | Explanation |
|---|---|---|
| Continue / Pause | F5 |
Continue : Resume normal program/script execution (up to the next breakpoint). Pause : Inspect code executing at the current line and debug line-by-line. |
| Step Over | F10 |
Execute the next method as a single command without inspecting or following its component steps. |
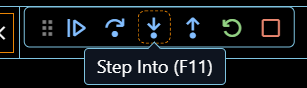
| Step Into | F11 |
Enter the next method to follow its execution line-by-line. |
| Step Out | Shift+F11 |
When inside a method or subroutine, return to the earlier execution context by completing remaining lines of the current method as though it were a single command. |
| Restart | Ctrl+Shift+F5 |
Terminate the current program execution and start debugging again using the current run configuration. |
| Stop | Shift+F5 |
Terminate the current program execution. |
Debug a File
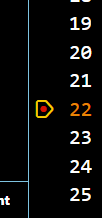
Insert breakpoints by selecting a line to place a “red dot”
Run > Start Debugging
Opens a terminal automatically
Variables visible on the left side
Walk through the debug tools


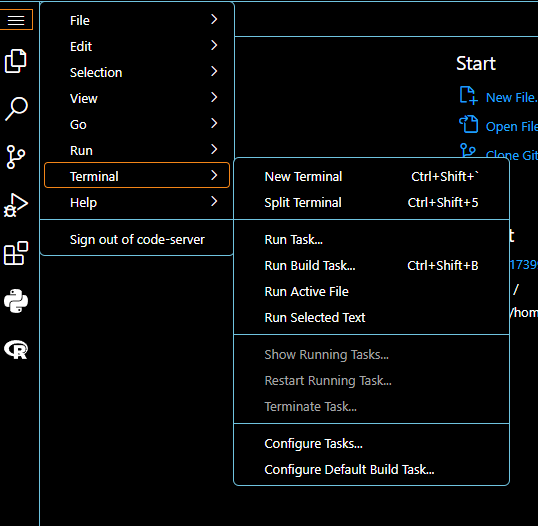
Open a Terminal
Terminal > New Terminal
From here you can use regular terminal commands like pwd or even load modules!

Create a Conda Environment
In a new terminal:
conda create -n my_env python=3.11 numpy pandas
conda activate my_env
pip install matplotlib
Set Your Interpreter
Select your environment from your list!
When you run your code it will run in your environment.


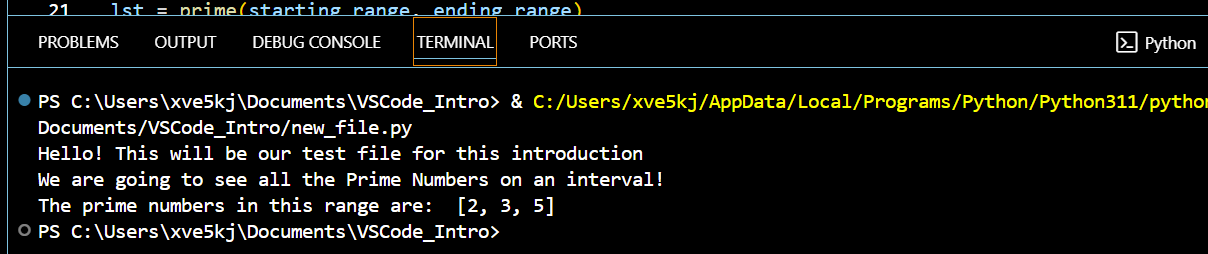
Run a File
Modify your file with some basic runnable python code
Run > Run Without Debugging
Opens a terminal automatically


Jupyter Notebooks
Select kernel from the list of available kernels- or make your own!
Recently used kernels are “starred”

Create your own kernel from a conda environment:
Custom Jupyter Kernels (RC Documentation)
Customization
File > Preferences
These changes stay even when you open a new interactive session
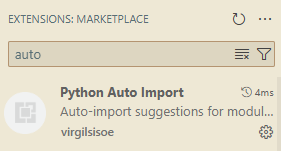
You can even download extra extensions!