Performance Optimization
To access GitHub resources for these notes, visit https://github.com/sdsc/sdsc-summer-institute-2022/tree/main/4.3a_performance_tuning
The Importance of Writing Efficient Scalar/Serial Code
Optimizing your code will reduce your time to solution.
Challenging problems become doable and routine calculations can be done more quickly. You’ll be able to do more science in the same amount of time and shorten the cycle between job submission and results.
Computer time, particularly on high-end resources is limited.
If you’re running on XSEDE-allocated resources, such as Expanse, you need to compete with other users for access. If you’re running on the cloud, you’ll need to pay.
Computing uses a lot of energy.
It is estimated that a significant percentage of U.S. energy consumption is used to power computers and networking equipment.
Guidelines for Software Optimization
- Don’t break your code - make sure you still get correct results
- Profile your code so that you know where to focus your effort
- Don’t obfuscate your code unless you have a really compelling reason (e.g. changes to kernel in heavily use application)
- Document your changes, especially if the new code looks significantly different from the original
- Use optimized libraries when possible
- Understand the capabilities and limitations of your compiler
How much effort should you put into optimizing your code?
The amount of time and effort you spend on optimizing your code depends on a number of factors:
- Is the code heavily/widely used?
- Does the code consume a significant amount of computer time?
- Is time to solution important?
- Will optimizing your code help you solve new sets of problems?
- Have you reached the point where most of the computing occurs in routines outside your control?
- Would your time be better spent doing your research?
Why should you profile your code?
- Determine what portions of your code are using the most time
- Modern HPC and data intensive software often comprises many thousands of lines of code. Before you start trying to improve the performance, you need to know where to spend your effort.
- Figure out why those portions of your code take so much time
- Understanding why a section of code is so time consuming can provide valuable insights into how it can be improved
Manually Instrumenting C/C++ Codes
Generalizable for any user-written code
The C gettimeofday() function returns time from start of epoch (1/1/1970) with microsecond precision. Call before and after the block of code to be timed and perform math using the tv_sec and tv_usec struct elements.
struct timeval tv_start, tv_end;

gettimeofday(&tv_start, NULL);
// block of code to be timed
gettimeofday(&tv_end, NULL);

elapsed = (tv_end.tv_sec - tv_start.tv_sec) + (tv_end.tv_usec - tv_start.tv_usec) / 1000000.0;
Use a Code Profiler
Profiling your code with gprof
gprof is a profiling tool for UNIX/Linux applications. First developed in 1982, it is still extremely popular and very widely used.
- Universally supported by all major C/C++ and Fortran compilers
- Extremely easy to use
- Compile code with
-pgoption: adds instrumentation to executable - Run application: file named gmon.out will be created
- Run
gprofto generate profile:gprof a.out gmon.out
- Compile code with
- Introduces virtually no overhead
- Output is easy to interpret
Make Sure Multidimensional Arrays are Indexed Properly
Multidimensional arrays - array addition example
Properly written Fortran code (leftmose index varies fastest):
do j=1, n   ! Note loop nesting
    do i=1,n
        z(i,j) = x(i,j) + y(i,j)
    enddo
enddo
Properly written C code (rightmost index varies fastest):
for (i=0; i<n; i++) {   // Note loop nesting
    for (j=0; j<n; j++) {
        z[i][j] = x[i][j] + y[i][j]
    }
}
Summary
- Optimizing your code reduces time to solution, saves energy and make resources go further
- Before you get started, make sure it’s worth your effort
- Optimization can change results, ask yourself ‘how critical is reproducibility?’
- Profile, optimize, repeat…
- Take advantage of optimized libraries and the work of others
- Good programmers write good code
- Great programmers steal great code
- Know the capabilities and limitations of your compiler, but don’t rely on the compiler to fix all your bad programming practices
- Optimizing for cache is critical - exploit spatial & temporal locality
- The biggest payoffs often come from a deep understanding of the semantics and structure of your code
Using the Linux top/htop Utility
The top utility is found on all Linux systems and provides a high level view of running processes. It does not give any information at the source code level (profiling), but can still be very useful for answering questions such as:
- How many of my processes are running?
- What are the states of the processes (running, sleeping, etc.)?
- Which cores are being utilized?
- Are there any competing processes that may be affecting my performance?
- What fraction of the CPU is each process using?
- How much memory does each process use?
- Is the memory usage growing over time? (Useful for identifying memory leaks)
- How many threads are my processes using?
Customizing top
top has the following defaults, but is easily customizable:
- Processes only (no threads)
- To toggle threads display, type H while
topis running
- To toggle threads display, type H while
- Information for all users
- Can restrict to a single user by launching with
top -u username
- Can restrict to a single user by launching with
- Process ID, priority, ’nice’ level, virtual memory, physical memory, shared memory, state, %CPU, %memory, CPU time, command
- To modify, type F while top is running and toggle fields using letters
- Update information every 3 seconds
- Change refresh rate by launching with
top -d n
- Change refresh rate by launching with
- Ordered by CPU usage
- Type M to order by memory usage
Non-Threaded Code
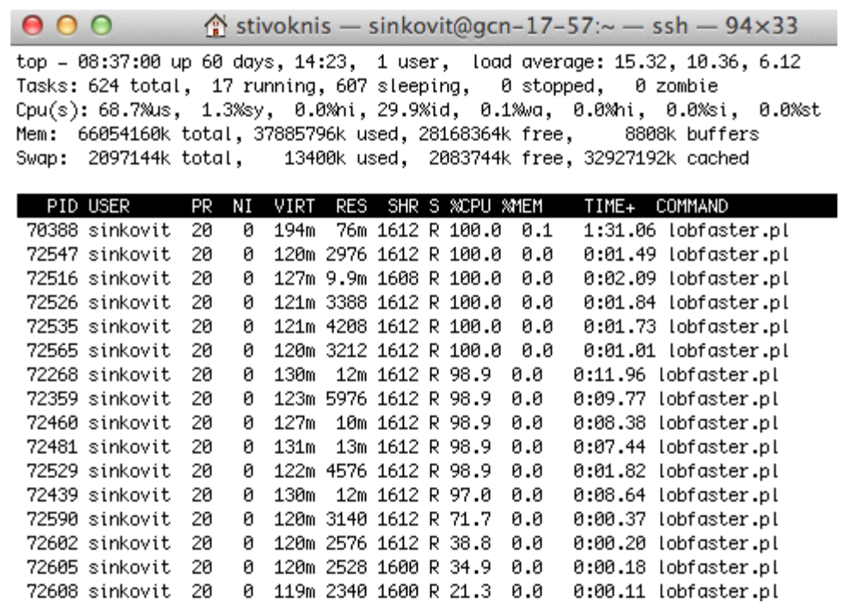
The above output shows 16 processes, each using anywhere from 21.3% to 100% of a computer core. The memory footprint (RES) is minimal, with each process only using up to 76 MB. CPU times range from 0.11s (just started) to 1:31.
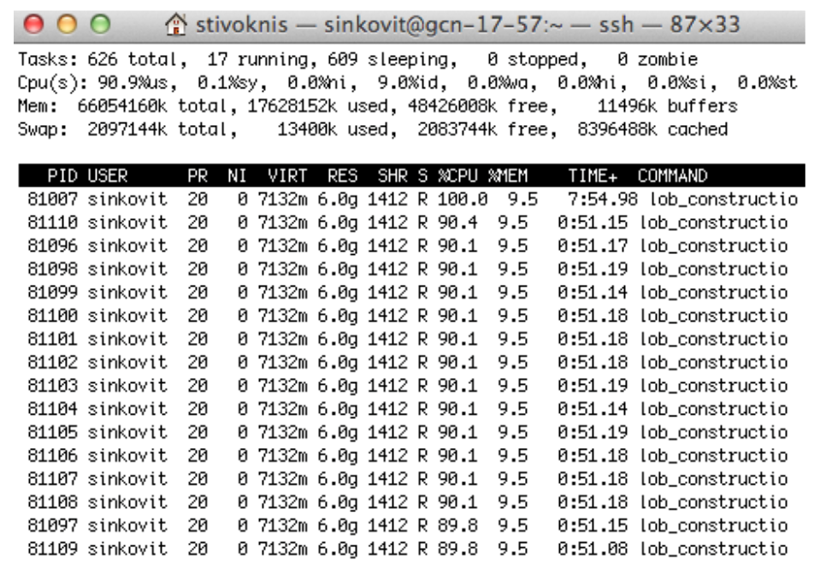
Threaded Code (Thread Display Off)

This output shows threaded code with thread display toggled to the “off” position. Note the heavy CPU usage, which is very close to 1600%.
Threaded Code (Thread Display On)

This output shows 16 threads, with only one thread making good use of CPU. The total memory usage is 5.8 GB (9.2% of available memory).
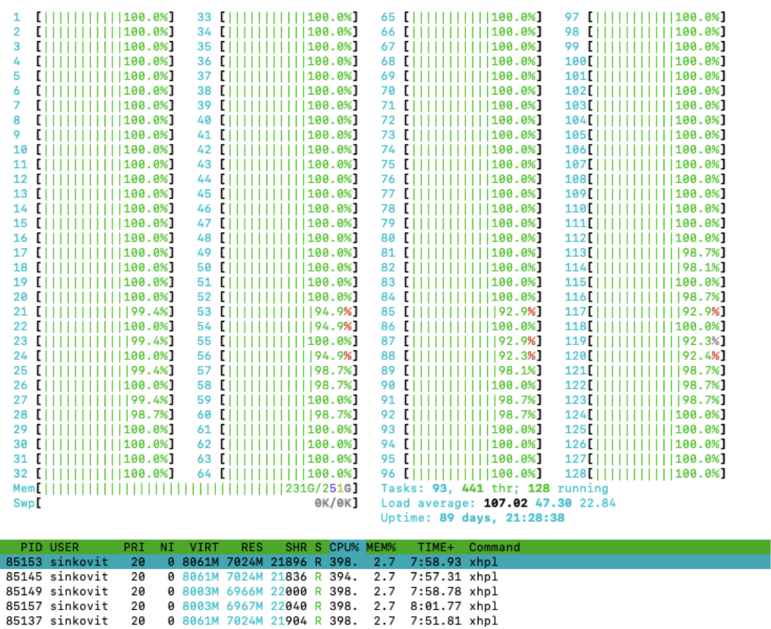
Threaded Code (Thread Display On)
This output shows 16 threads, all making good (but not ideal) use of the computer cores.
htop
htop is like top, but with better interface, vertical and horizontal scrolling, process tree view, etc.
Constructing Resource-Efficient Slurm Scripts
Shell script to monitor and record CPU/memory usage using top:
#! /bin/bash
# This script takes four command line arguments, samples the output of the top command and stores the output of the sampling in the file named Top.out.
# $1 is the user ID of the owner of the processes to sample from the top output
# $2 is the name to include in the top output filename
# $3 is the top sampling interval
# $4 is the name of the code to be tracked (as shown in top)
# Example of line to include in slurm script submission before executable invoked
# ./sampleTop.sh <user_id> <filename> 10 <code_name> &
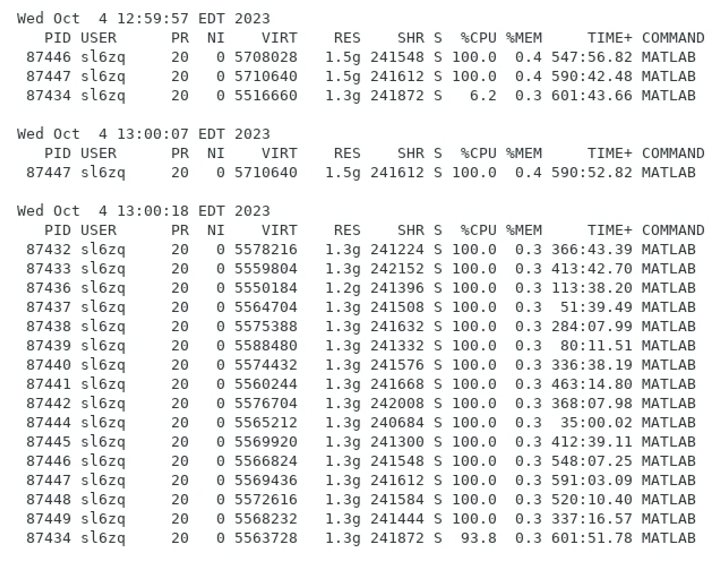
Output file from shell script to monitor job resource usage:
Further Resources
- Writing Clean Scientific Software: http://ideas-productivity.org/wordpress/wp-content/uploads/2023/07/hpcbp-076-cleanssw.pdf
- San Diego Supercomputing Center: Advanced Training: https://www.sdsc.edu/education_and_training/training_hpc.html
- SDSC Advanced Computing Training Catalog: https://www.sdsc.edu/education_and_training/training_catalog.html
- SDSC Interactive Video Training Catalog: https://education.sdsc.edu/training/interactive/ciml_si21/index.html
Additional References
- Slurm Quick Start User Guide: https://slurm.schedmd.com/quickstart.html
- HPCWIKI: Scheduling Basics: https://hpc-wiki.info/hpc/Scheduling_Basics
- Intro to HPC: https://carpentries-incubator.github.io/hpc-intro
- HPC in a Day: https://psteinb.github.io/hpc-in-a-day